
The Soldano Report
Bay Ridge, Brooklyn Real Estate Market Report
Every Bay Ridge co-op, condo, single family, and multi family sale, tracked and published monthly by Soldano Realty.
 September 2026 edition, PDF
September 2026 Snapshot
Bay Ridge Real Estate Market: September 2026
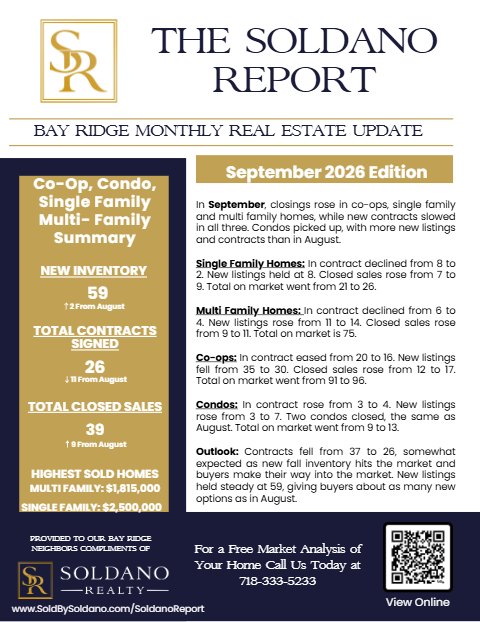
In September 2026, the Bay Ridge market recorded 59 new listings, 26 homes entering contract, and 39 closed sales across co-ops, condos, single family, and multi family homes, with roughly 210 properties active. Closings rose from 30 in August to 39, the most of any month this year, while contracts fell from 37 to 26, the fewest since February.
Co-ops led the closings with 17 sales at a median of $390,000, up from 12 in August, along with 30 new listings and 16 contracts. Single family closings rose from 7 to 9 while contracts fell from 8 to 2. Multi family recorded 14 new listings, 4 contracts, and 11 closings led by a $1,815,000 mixed use sale. Condos added 7 new listings and 4 contracts, with 2 closings. The month's highest sale was a $2,500,000 detached single family home.
Co-op
Seventeen closings at a median of $390,000, up from 12 in August. Contracts eased from 20 to 16.
Condo
Seven new listings and four contracts; two closings, at $775,000 and $807,000.
Multi Family
Eleven closings, the highest a $1,815,000 mixed use property. Contracts fell from 6 to 4.
Single Family
Closings rose from 7 to 9 while contracts fell from 8 to 2. Highest sale $2,500,000.
Own a home in Bay Ridge?
Get a free market analysis of your home from Soldano Realty, with the recent sales behind the number.
Prefer to text? Text 718-333-5233 and an agent replies during business hours.
Watch: Daniel Soldano on the Numbers
The Soldano Report for September 2026, the monthly Bay Ridge, Brooklyn real estate market update from Soldano Realty.
New market videos post monthly. Subscribe to Soldano Realty on YouTube.
Prefer the designed booklet? The full September 2026 report with complete tables for every property type, formatted to save or print.
Download the September 2026 Report (PDF)2026 Trends
Bay Ridge Market Trends: 2026
Nine months of Bay Ridge activity across all four property types.
| Month | New Listings | In Contract | Closed Sales | Co-op Median | Closed Sales 2025 |
|---|---|---|---|---|---|
| January | 46 | 23 | 37 | $320,000 | 20 |
| February | 41 | 20 | 25 | $290,000 | 28 |
| March | 61 | 31 | 32 | $365,000 | 34 |
| April | 69 | 37 | 25 | $466,250 | 24 |
| May | 56 | 38 | 24 | $325,000 | 23 |
| June | 55 | 41 | 34 | $352,500 | 24 |
| July | 64 | 43 | 34 | $327,500 | 44 |
| August | 57 | 37 | 30 | $372,500 | 28 |
| September | 59 | 26 | 39 | $390,000 | 29 |
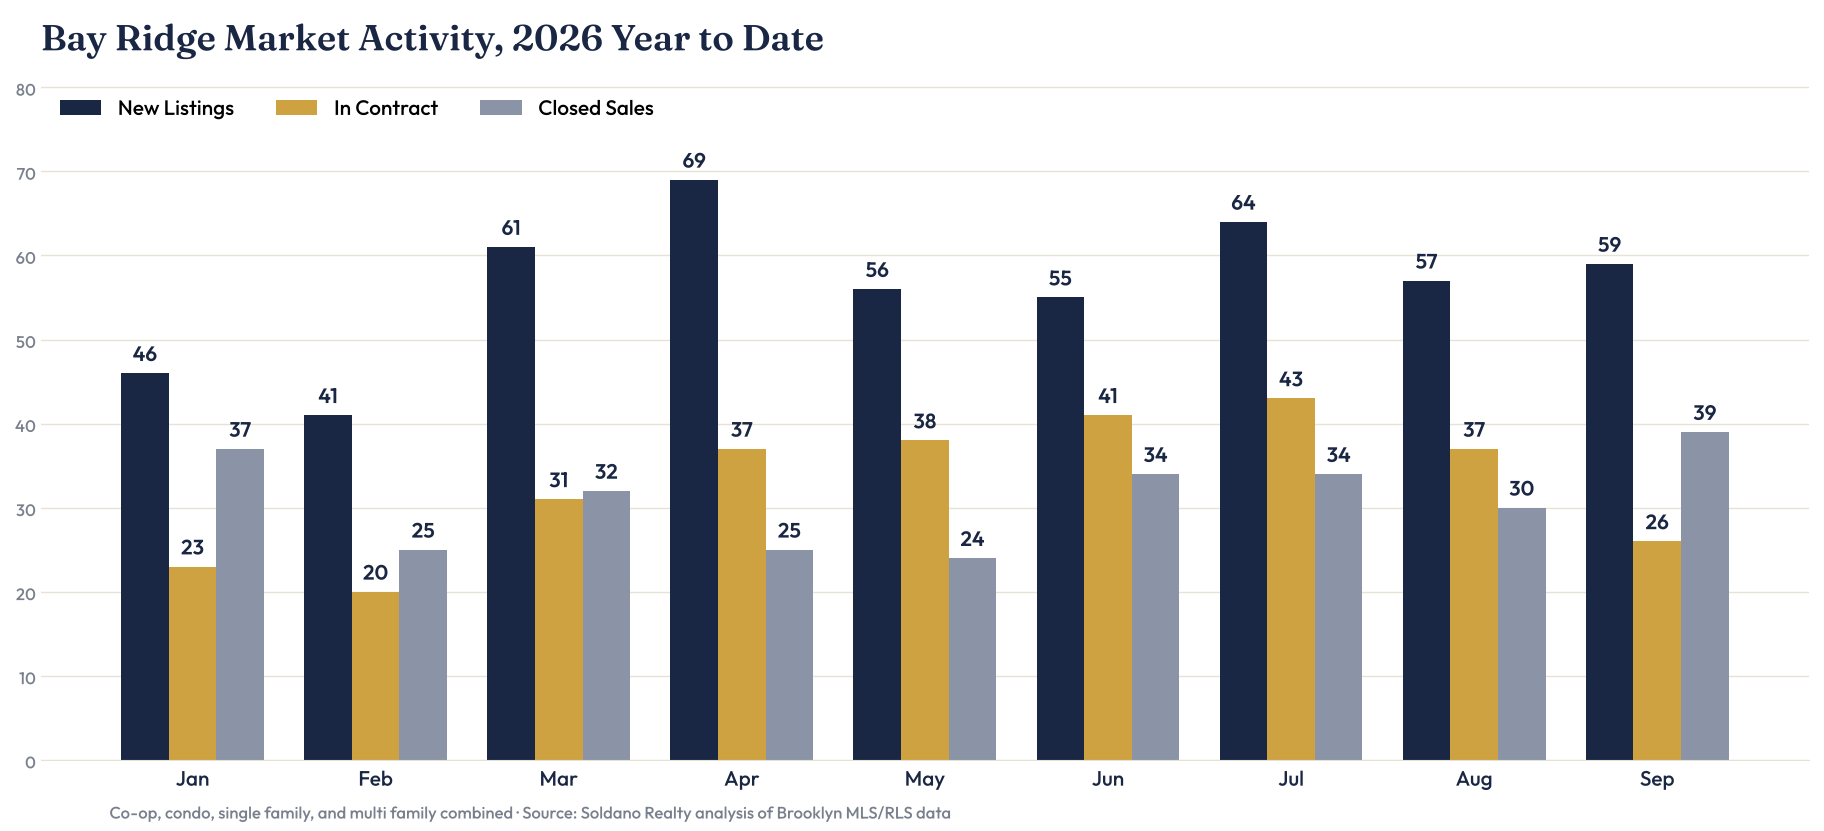
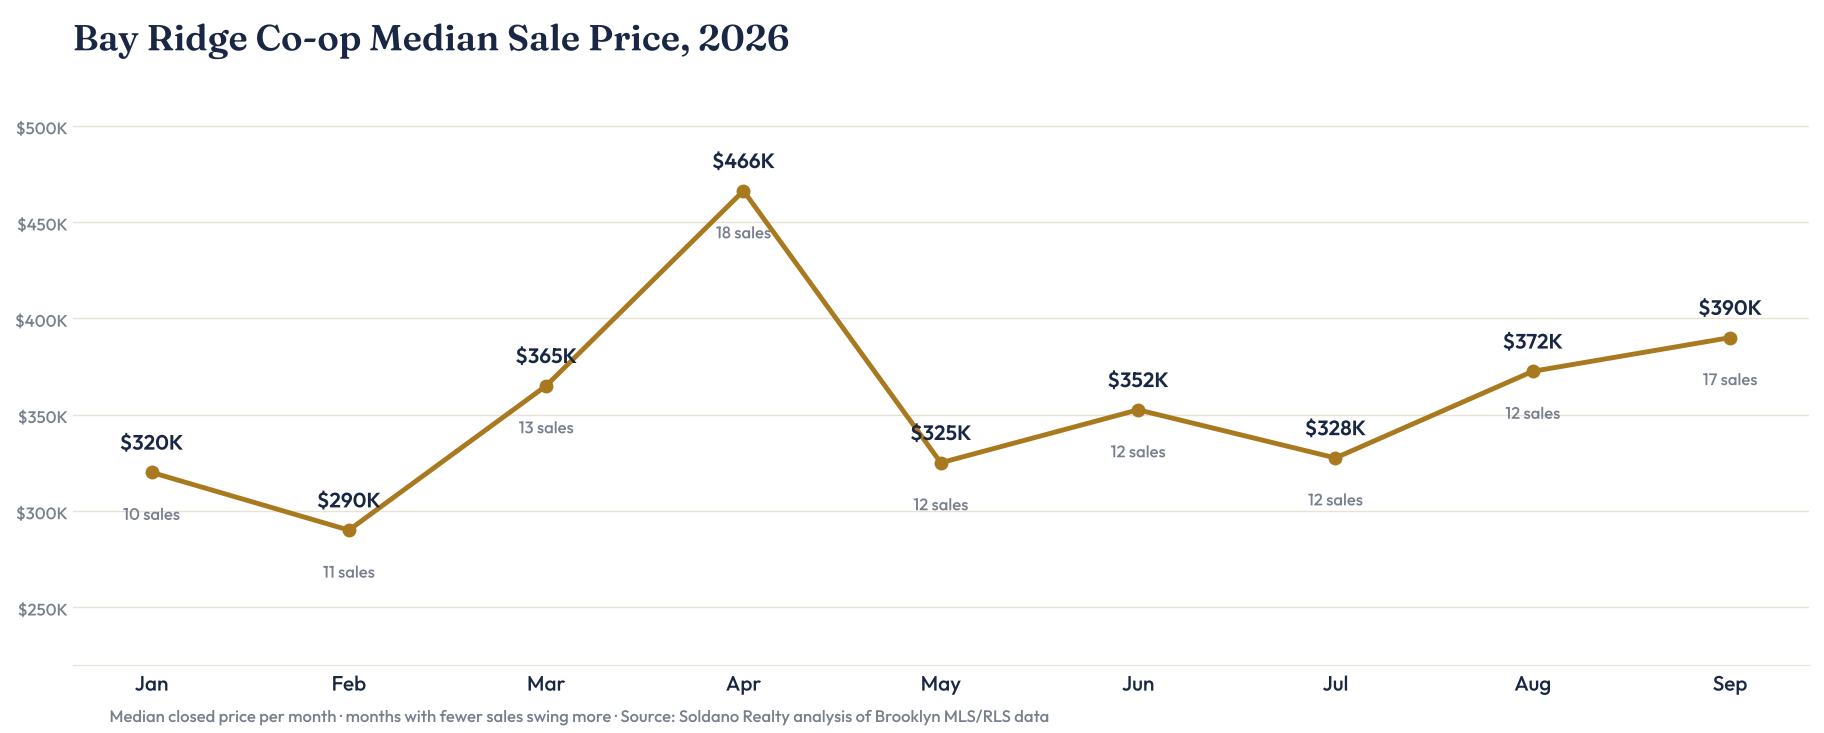
Through nine months, Bay Ridge has averaged about 56 new listings and 31 closed sales a month. Homes entering contract climbed from 23 in January to 43 in July, the highest month of 2026, then eased to 37 in August and 26 in September. Closings reached 39 in September, the most of any month this year. The co-op median has ranged from $290,000 to $466,250 depending on each month's mix of studios, one bedrooms, and two bedrooms; September's 17 co-op sales had a median of $390,000.
Year Over Year
Bay Ridge: 2026 vs 2025
How this September and the year to date compare with the same period last year.
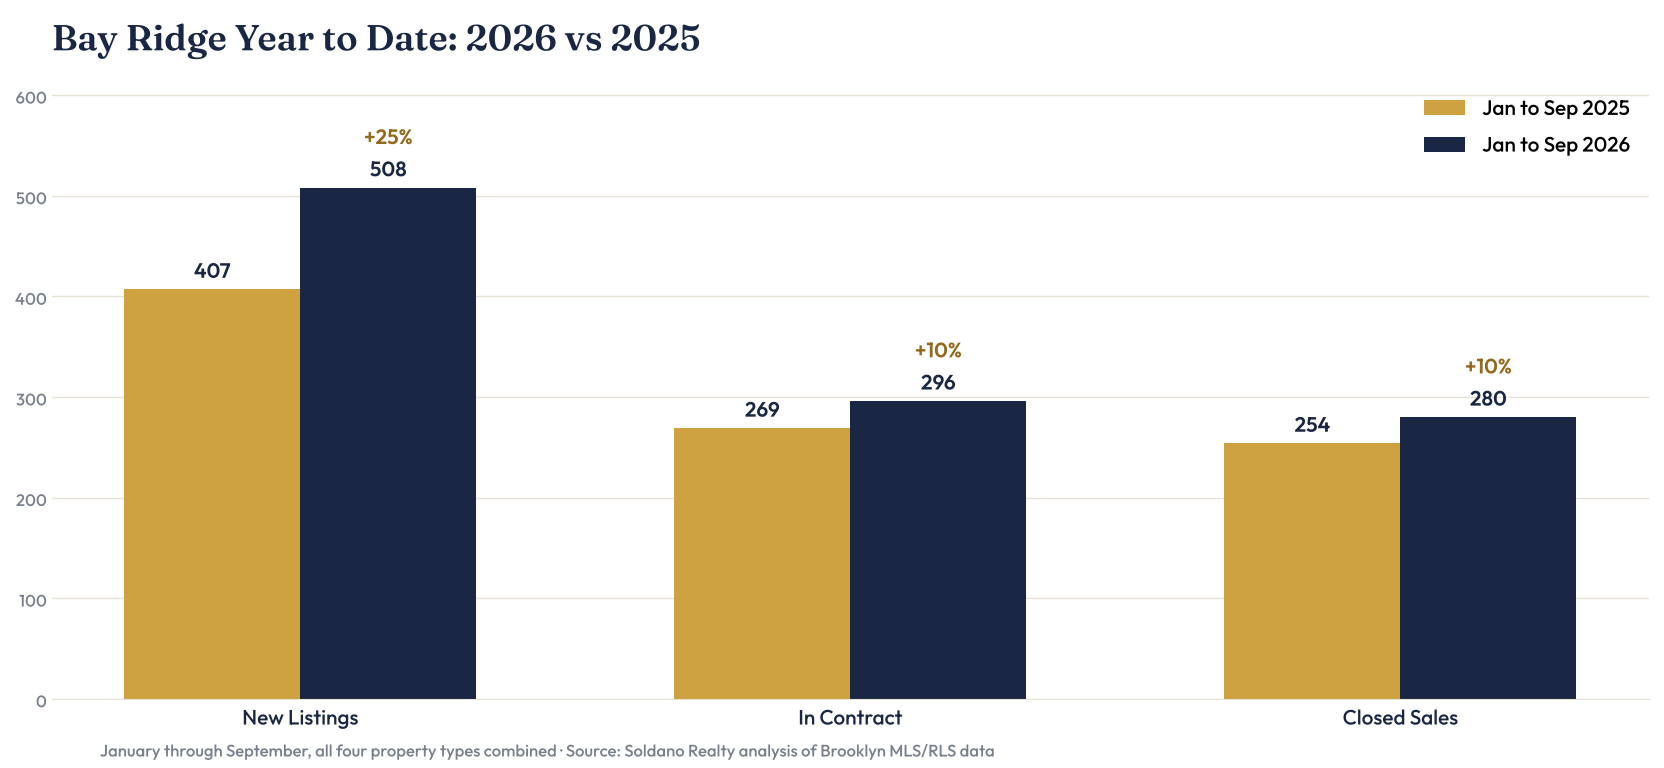
September 2026 brought more listings and more closings than September 2025: new listings rose from 51 to 59 and closed sales from 29 to 39, while contracts fell from 31 to 26. Measured across the year to date, 2026 is ahead of 2025 on every count: 508 new listings versus 407, 296 contracts versus 269, and 280 closed sales versus 254, and the median closed price is higher in all four property types.
| Type | Closings 2025 | Closings 2026 | Median 2025 | Median 2026 | Median Change |
|---|---|---|---|---|---|
| Co-op | 115 | 117 | $350,000 | $360,000 | +2.9% |
| Condo | 15 | 22 | $838,000 | $859,250 | +2.5% |
| Multi Family | 67 | 77 | $1,500,000 | $1,550,000 | +3.3% |
| Single Family | 57 | 64 | $1,350,000 | $1,449,250 | +7.4% |
| All Types | 254 | 280 | — | +10.2% closings | |
Medians are pooled closed prices, January through September of each year. Condo volume is small in both years; treat its median move as directional.
Full Market Data
Bay Ridge Market: Full Breakdown by Property Type
Every segment for September 2026, by bedroom count and home type. Tap a section to expand.
Co-op: full September breakdown
| Bedrooms | # New | Avg List | Price Range | Avg PPSF | Active |
|---|---|---|---|---|---|
| Studios | 2 | $359,500 | $259K–$460K | $518 | 4 |
| 1 Beds | 16 | $358,937 | $209K–$499K | $500 | 59 |
| 2 Beds | 10 | $617,300 | $429K–$865K | $554 | 31 |
| 3+ Beds | 2 | $1,012,500 | $975K–$1.05M | — | 2 |
| All Co-ops | 30 | $587,059 | $209K–$1.05M | $524 | 96 |
| Bedrooms | # In Contract | Avg List | Price Range | Avg DOM | Total |
|---|---|---|---|---|---|
| Studios | 1 | $379,999 | $380K–$380K | 55 | 8 |
| 1 Beds | 12 | $349,242 | $299K–$475K | 128 | 32 |
| 2 Beds | 1 | $538,888 | $539K–$539K | 129 | 7 |
| 3+ Beds | 2 | $1,147,500 | $995K–$1.3M | 3 | 0 |
| All Co-ops | 16 | $603,907 | $299K–$1.3M | 79 | 47 |
| Bedrooms | # Sold | Avg Sold | Price Range | Avg DOM | Sold-to-List |
|---|---|---|---|---|---|
| Studios | 2 | $242,000 | $225K–$259K | 155 | 97.87% |
| 1 Beds | 9 | $365,556 | $282K–$470K | 121 | 98.23% |
| 2 Beds | 6 | $522,500 | $390K–$725K | 174 | 99.10% |
| 3+ Beds | 0 | — | — | — | — |
| All Co-ops | 17 | $376,685 | $225K–$725K | 150 | 98.40% |
Condo: full September breakdown
| Bedrooms | # New | Avg List | Price Range | Avg PPSF | Active |
|---|---|---|---|---|---|
| Studios | 0 | — | — | — | 2 |
| 1 Beds | 1 | $575,000 | $575K–$575K | $858 | 5 |
| 2 Beds | 6 | $979,481 | $840K–$1.4M | $957 | 5 |
| 3+ Beds | 0 | — | — | — | 1 |
| All Condos | 7 | $777,241 | $575K–$1.4M | $907 | 13 |
| Bedrooms | # In Contract | Avg List | Price Range | Avg DOM | Total |
|---|---|---|---|---|---|
| Studios | 0 | — | — | — | 0 |
| 1 Beds | 3 | $571,000 | $508K–$680K | 82 | 3 |
| 2 Beds | 1 | $588,000 | $588K–$588K | 83 | 1 |
| 3+ Beds | 0 | — | — | — | 0 |
| All Condos | 4 | $579,500 | $508K–$680K | 82 | 4 |
| Bedrooms | # Sold | Avg Sold | Price Range | Avg DOM | Sold-to-List |
|---|---|---|---|---|---|
| Studios | 0 | — | — | — | — |
| 1 Beds | 0 | — | — | — | — |
| 2 Beds | 1 | $807,000 | $807K–$807K | 97 | 100.25% |
| 3+ Beds | 1 | $775,000 | $775K–$775K | — | — |
| All Condos | 2 | $791,000 | $775K–$807K | 97 | 100.25% |
Multi Family: full September breakdown
| Home Type | # New | Avg List | Price Range | Avg PPSF | Active |
|---|---|---|---|---|---|
| Two Family | 7 | $1,816,429 | $1.38M–$3.39M | $704 | 27 |
| Three Family | 2 | $1,547,000 | $1.4M–$1.7M | $572 | 8 |
| 4-6 Family | 2 | $1,850,000 | $1.45M–$2.25M | $605 | 15 |
| Mixed Use | 3 | $1,859,296 | $1.69M–$2M | $696 | 25 |
| All Multi Family | 14 | $1,768,181 | $1.38M–$3.39M | $644 | 75 |
| Home Type | # In Contract | Avg List | Price Range | Avg DOM | Total |
|---|---|---|---|---|---|
| Two Family | 2 | $1,874,000 | $1.8M–$1.95M | 106 | 12 |
| Three Family | 0 | — | — | — | 1 |
| 4-6 Family | 0 | — | — | — | 2 |
| Mixed Use | 2 | $1,900,000 | $1.8M–$2M | 39 | 12 |
| All Multi Family | 4 | $1,887,000 | $1.8M–$2M | 72 | 27 |
| Home Type | # Sold | Avg Sold | Price Range | Avg DOM | Sold-to-List |
|---|---|---|---|---|---|
| Two Family | 6 | $1,453,000 | $1.3M–$1.7M | 58 | 96% |
| Three Family | 0 | — | — | — | — |
| 4-6 Family | 3 | $1,053,333 | $950K–$1.18M | 193 | 87% |
| Mixed Use | 2 | $1,757,500 | $1.7M–$1.81M | — | — |
| All Multi Family | 11 | $1,421,278 | $950K–$1.81M | 126 | 91% |
Single Family: full September breakdown
| Home Type | # New | Avg List | Price Range | Avg PPSF | Active |
|---|---|---|---|---|---|
| Attached | 0 | — | — | — | 1 |
| Attached + Parking | 1 | $1,025,000 | $1.02M–$1.02M | $833 | 2 |
| Semi-Detached | 3 | $1,383,333 | $1.25M–$1.55M | $742 | 10 |
| Detached | 4 | $1,522,475 | $800K–$2M | $749 | 13 |
| All Single Family | 8 | $1,310,269 | $800K–$2M | $774 | 26 |
| Home Type | # In Contract | Avg List | Price Range | Avg DOM | Total |
|---|---|---|---|---|---|
| Attached | 0 | — | — | — | 0 |
| Attached + Parking | 0 | — | — | — | 2 |
| Semi-Detached | 1 | $1,850,000 | $1.85M–$1.85M | 37 | 7 |
| Detached | 1 | $1,899,000 | $1.9M–$1.9M | 87 | 3 |
| All Single Family | 2 | $1,874,500 | $1.85M–$1.9M | 62 | 12 |
| Home Type | # Sold | Avg Sold | Price Range | Avg DOM | Sold-to-List |
|---|---|---|---|---|---|
| Attached | 0 | — | — | — | — |
| Attached + Parking | 3 | $1,112,667 | $998K–$1.2M | 56.33 | 97% |
| Semi-Detached | 2 | $1,555,000 | $1.26M–$1.85M | 161 | 92% |
| Detached | 4 | $1,890,750 | $1.35M–$2.5M | 36 | 92% |
| All Single Family | 9 | $1,519,472 | $998K–$2.5M | 84.44 | 93% |
Bay Ridge Buildings
Featured Bay Ridge Building Guides
Market wide numbers tell part of the story. In Bay Ridge, value often comes down to the building: maintenance, amenities, sublet policy, and recent sales. Start with these building guides:
Bay Ridge Market Questions
Common Questions About the Bay Ridge Market
Is Bay Ridge a buyer's or seller's market right now?
September 2026 was mixed: closings rose to 39, the most of any month this year, while contracts slowed to 26 and 59 new listings came to market, with about 210 homes available across all four property types. Closed sales averaged about 93% to 100% of the last asking price depending on property type.
Are Bay Ridge co-ops selling?
Yes. Seventeen co-ops closed in September, up from 12 in August, and 16 more entered contract, while 30 new co-ops were listed. Closed co-ops averaged about 98% of their last asking price, and the month's median co-op sale was $390,000.
Which property type is most active in Bay Ridge?
Co-ops, by a wide margin: 30 new listings, 16 contracts, and 17 closings in September. Multi family followed with 11 closings, single family closed 9, and condos closed 2.
Are Bay Ridge multi family homes still in demand?
Yes. Eleven multi family homes closed in September, up from 9 in August, led by a $1,815,000 mixed use sale, and 14 new listings came to market. Two family homes sold at about 96% of asking on average, and 75 multi family and mixed use homes were on the market.
How much are Bay Ridge single family homes selling for?
Over the three months through September 2026, 23 single family homes closed at a median of $1,650,000, ranging from $998,000 to $3,675,000. September's highest sale was a detached house at $2,500,000, and the September closings with an asking price averaged about 94% of asking.
What is the average Bay Ridge condo price?
Condo volume is low, so a trailing three month view is more reliable. Through September 2026, seven condos closed at a median of $807,000. September itself saw two closings, at $775,000 and $807,000, along with seven new listings and four contracts.
How does the Bay Ridge market compare to last year?
The market is ahead of 2025. Through September, 2026 has produced 508 new listings versus 407 last year, 296 contracts versus 269, and 280 closed sales versus 254. Median closed prices are higher year over year in all four property types, led by single family at $1,449,250 versus $1,350,000.
How often is The Soldano Report updated?
The report is updated monthly. Each edition compiles Bay Ridge co-op, condo, multi family, and single family activity from MLS and RLS data.
About
About the Soldano Report

The Soldano Report is a monthly Bay Ridge real estate market report that tracks co-op, condo, single family, and multi family listings, contracts, and closed sales across the neighborhood of Bay Ridge in Brooklyn, New York. It compiles Bay Ridge sales activity from the Brooklyn MLS and RLS, cross checked against Soldano Realty transaction records. Current month figures reflect September 2026. Prices for lower volume categories (condo, multi family, single family) use a trailing three month window so a single sale does not distort the picture.
Definitions: PPSF is price per square foot; DOM is days on market; sold-to-list is the sale price as a percentage of the last list price. Updated monthly.
Report Archive
Past Bay Ridge Market Reports
Reading this month's edition? Download the September 2026 booklet (PDF) →
August 2026
57 new listings, 37 in contract, 30 closed. Co-ops posted 35 new listings, the most of any 2026 month.
View the August 2026 report →Download PDF
July 2026
64 new listings, 43 in contract, 34 closed. Both new inventory and contracts reached 2026 highs.
View the July 2026 report →Download PDF
June 2026
55 new listings, 41 in contract, 34 closed. Contracts hit a first half high.
View the June 2026 report →Download PDF
More 2026 reports: May 2026 · April 2026 · March 2026 · February 2026 · January 2026
Older editions: 2025 and 2024
2025 reports: December 2025 · November 2025 · October 2025 · September 2025 · August 2025 · July 2025 · June 2025 · May 2025 · April 2025 · March 2025 · February 2025 · January 2025
2024 reports (PDF): December 2024 · November 2024 · October 2024 · September 2024 · August 2024 · July 2024
Monthly Delivery
Get the Soldano Report in Your Inbox Every Month
Bay Ridge's only monthly market report with co-op, condo, single family, and multi family breakdowns, sent to you the moment it's published. No spam, one email a month, unsubscribe anytime.
Source: Soldano Realty analysis of Brooklyn MLS/RLS data for Bay Ridge, September 2026. Trailing prices reflect July–September 2026. Updated monthly. Last updated October 2026.
Sign up now to receive your free copy of the Soldano Report monthly! This is the most comprehensive look at the Bay Ridge Real Estate Market you will find anywhere!